
Time is Money!
Computational Tools / Software are used to solve Partial Differential Equations (PDE) with the help of numerical methods and discretization of elements into grids, commonly known as mesh.
Analysis of fluid behavioral patterns, known as Computational Fluid Dynamics (CFD), aims at solving Navier-Stokes (N-S) Equation coupled with boundary conditions. There are a number of physics-based solvers such as Reynolds Averaged Navier-Stokes (RANS), Large Eddy Simulation (LES), etc that leverage numerical solutions using discretized and staggered grids. Computational Software that automates this process can take anywhere from hours to days of computation time depending upon the complexity of problem adding significantly to the Project period.
Why Reduced Order Model (ROM)?
ROM effectively reduces computational cost from Hours to Minutes, providing enough accuracy for validation. ROM has a lot of other advantages, some of them being:
- Optimization of Product Designs
- Creating and Analyzing Digital Twins
- Read more about Digital Nameplate Assets, DNA
- Interpolation of intermediate Design Spaces
What exactly is a ROM?
A ROM is a simplified solution of high-fidelity models that involve complex PDE. ROM techniques reduce the computational and storage requirements of a computer model while preserving the essence of the data behavior.
ROMs – being purely data-driven – leverage matrix decomposition methods such as the Proper Orthogonal Decomposition (POD) or Principal Component Analysis (PCA) for converting high dimensional data into low dimensional data.
Let’s dig a little deeper into the ‘ What ‘ and the ‘ How ‘ of POD:
POD uses Singular Value Decomposition (SVD) to solve the eigen value problem, thereby reducing the computational cost by a significant amount, while indirectly capturing the physics involved in the data.
A.X = λ.X
The data from the computational software (X) is rearranged (decomposed) into a combination of matrices.
X = U.Σ.V'
Matrices U and V are orthonormal (each column has unit length and each column is orthogonal to the others), while Σ is a diagonal matrix. The relationship to PCA is that:
X = T.P'
Matrix P is orthonormal. So taking the SVD on preprocessed matrix X allows us to get the POD/ PCA model by setting P = V, and T = U.Σ . The diagonal terms in Σ are related to the variances of each principal component and can be plotted as a scree plot.
Phew! That’s a LOT of Mathematics! Time to see some ROM action!
Case Study to analyze ROM:
As a part of the team at Tridiagonal Solutions that provide services Pharmaceutical companies, I work extensively with stirred tanks, also known as Bioreactors. There are various parameters known as the Process Variables (PV’s) that affect the environment of the mixture and ultimately the Quality Attributes, most commonly the Agitator Speed, Viscosity, and Density of the liquid.
So, I have implemented ROM for predicting an intermediate design space of a 50L Sartorius Bioreactor for operating conditions of 130 RPM agitator speed, 5 cP viscosity of the liquid. Then, I compared the ROM-generated results with Computation Software, in this case, Tridiagonal’s MixIT software.
I have compared three data signatures (U_mag, k, and epsilon) which cover the essential process metrics of a mixing tank:
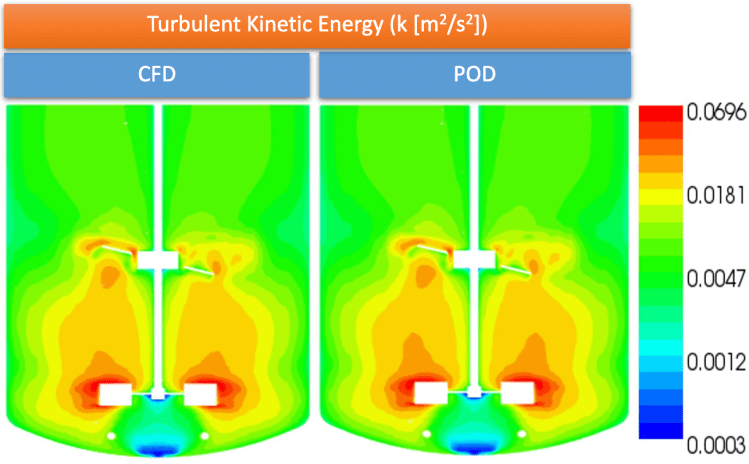
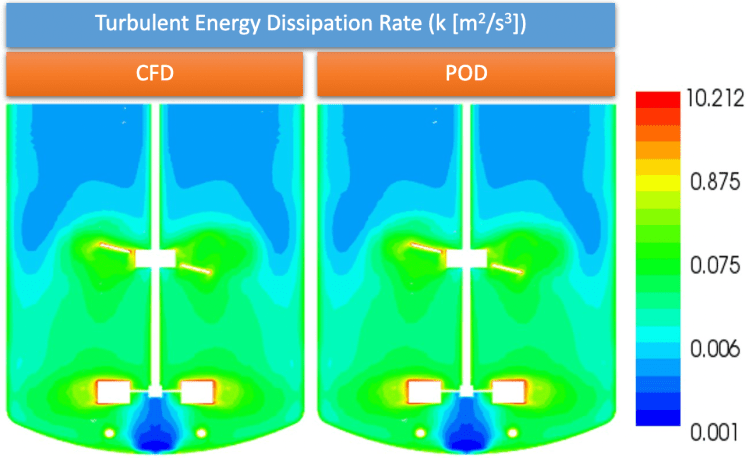
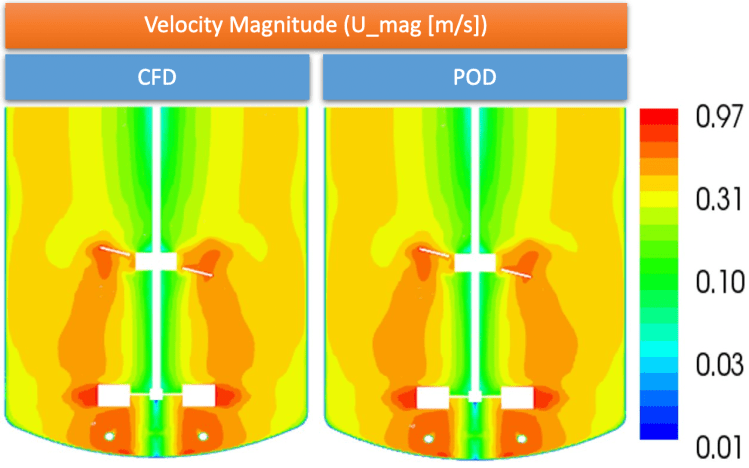
To give context, the time required to generate CFD results was in the range of 3-4 hours whereas the POD method generated results within ~2 mins.
Yes, you READ that right! One can clearly see how efficient ROM is!
This is a simple high-level flowchart that shows how ROM is implemented with the help of an existing Asset Library.

Using ROM doesn’t completely remove the need to carry out computational solutions, but once a library of simulations (spanning an efficiently designed DoE) is established, new solutions can be predicted in a matter of minutes as shown above.
Obviously, we have only described the tip of the iceberg here. Stay tuned for more informative blogs in this space!
